Wednesday, April 29, 2015

Fluid Imbalance as a Symptom of Burns

Fluid Loss

Recall that when tissue is burned, an inflammatory response is activated. Part of this inflammatory response causes capillaries to become leaky. It is thought that there is also a cellular shift of sodium that also adds to the drastic loss of intravascular fluid. This loss of fluid from the intravascular space causes burn shock. Burn shock is a combination of hypovolemic, cardiogenic, and distributive shock. As fluids leave the intravascular space, the blood cells become very concentrated. Intravascular hypovolemia reaches maximum levels around twelve hours after the initial injury. Reduced cardiovascular efficiency is also a result of this fluid loss. The heart's ability to pump efficiently is reduced due to low decreased plasma volume, increased afterload (the for that the heart pumps against), and decreased cardiac contractility. Obviously, burn patients need to undergo aggressive resuscitation within the first minutes, hours, and days of their burn.

Fluid Replacement

Burns that are less that 20% TBSA can be managed with oral resuscitation but intravascular resuscitation is more commonly done in the United States. Vomiting has become an issue for some burn patients when oral resuscitation has been attempted. Needless to say, for burns higher than 20% TBSA (and not involving the face), intravascular fluid resuscitation is the primary route of fluid replacement in the US. Numerous formulas are used to calculate the amount of fluid resuscitation that a burn patient may require. Typically, these formulas consider body weight and TBSA burned. Below are some of the more frequently formulas used, taken verbatim from Haberal, Sakallioglu Abali, and Karakayali's article titled, "Fluid management in major burn injuries (par 11-16)."


Adult Burn Fluid Resuscitation Formulas

Parkland formula

  1. Initial 24 hours: Ringer’s lactated (RL) solution 4 ml/kg/% burn for adults and 3 ml/kg/% burn for children. RL solution is added for maintenance for children:
    • 4 ml/kg/hour for children weighing 0–10 kg
    • 40 ml/hour +2 ml/hour for children weighing 10–20 kg
    • 60 ml/hour + 1 ml/kg/hour for children weighing 20 kg or higher
    This formula recommends no colloid in the initial 24 hours.
  2. Next 24 hours: Colloids given as 20–60% of calculated plasma volume. No crystalloids. Glucose in water is added in amounts required to maintain a urinary output of 0.5–1 ml/hour in adults and 1 ml/hour in children.

Modified Parkland formula

  1. Initial 24 hours: RL 4 ml/kg/% burn (adults)
  2. Next 24 hours: Begin colloid infusion of 5% albumin 0.3–1 ml/kg/% burn/16 per hour

Brooke formula

  1. Initial 24 hours: RL solution 1.5 ml/kg/% burn plus colloids 0.5 ml/kg/% burn plus 2000 ml glucose in water
  2. Next 24 hours: RL 0.5 ml/kg/% burn, colloids 0.25 ml/kg/% burn and the same amount of glucose in water as in the first 24 hours

Modified Brooke

  1. Initial 24 hours: No colloids. RL solution 2 ml/kg/% burn in adults and 3 ml/kg/% burn in children
  2. Next 24 hours: Colloids at 0.3–0.5 ml/kg/% burn and no crystalloids are given. Glucose in water is added in the amounts required to maintain good urinary output.

Evans formula (1952)

  1. First 24 hours: Crystalloids 1 ml/kg/% burn plus colloids at 1 ml/kg/% burn plus 2000 ml glucose in water
  2. Next 24 hours: Crystalloids at 0.5 ml/kg/% burn, colloids at 0.5 ml/kg/% burn and the same amount of glucose in water as in the first 24 hours

Monafo formula

Monafo recommends using a solution containing 250 mEq Na, 150 mEq lactate and 100 mEq Cl. The amount is adjusted according to the urine output. In the following 24 hours, the solution is titrated with 1/3 normal saline according to urinary output.

Pediatric Burn Fluid Resuscitation Formulas

Shriner’s cincinnati

Initial 24 hours:
  1. For older children:
    Lactated Ringer’s (RL) solution 4 ml/kg/% burn +1500 ml/m2 total (1/2 of total volume over 8 hours, rest of the total volume during the following 16 hours)
  2. For younger children:
    4 ml/kg/% burn +1500 ml/m2 total, in the first 8 hours
    RL solution + 50 mEq NaHCO3
    RL solution in the second 8 hours
    5% albumin in LR solution in the third 8 hours

Galveston

Initial 24 hours: RL 5000 ml/m2 burn + 2000 ml/m2 total (1/2 of total volume over 8 hours, rest of the total volume in 16 hours)

Some burn units, especially those specializing in pediatric burns, will adjust these formulas or use their own formula according to their expertise and the current situation.

Primary Work Consulted

Haberal, M., Sakallioglu Abali, A. E., & Karakayali, H. (2010). Fluid management in major burn injuries. Indian Journal of Plastic Surgery : Official Publication of the Association of Plastic Surgeons of India, 43(Suppl), S29–S36. doi:10.4103/0970-0358.70715

Wednesday, April 22, 2015

Diagnosis/Classification of Burns

Classification/Diagnosis of Burns

Burns are typically evaluated on a scale from one to three. First degree burns are characterized by damage only to the top layer of skin or epidermis. Sunburn is the most common example of first degree burns. Long term tissue damage is rare with second degree burns. Second degree burns involve the epidermis and partial involvement of the dermis or deeper layer of the skin (these burns are typically referred to as partial-thickness burns but note that second degree burns can also be full-thickness burns). Second degree burns can be blistered. Third degree burns penetrate the full depth of the epidermis and deeper dermis layer. These are referred to as full-thickness burns.  Some resources also describe forth degree burns to describe burns that have penetrated through the epidermis, dermis, and into the subcutaneous tissue (tendons, musculature, etc). Not all resources will use this fourth degree of classification but will instead use third degree burns to classify burns that penetrate subcutaneous tissue.
In my experience (which admittedly is limited), professionals that care for those who suffer from serious burns do not classify burns by degree but instead by thickness; describing burns as partial or full-thickness. Some continue to further describe partial burns as blanchable or non-blanchable.

Description of burns will also be described within the context of what caused the burn. Electrical burns are different than flame or chemical burns. 

 Diagnosing Total Body Surface Area (TBSA)

Additionally, burns are often characterized by the amount of total body surface area (TBSA %) that they cover. These measurements are rough estimates provided by using the patient's palm equaling 1% of the TBSA. Also, the rule of nine's is employed for estimation. Please see the illustrations below for further embellishment.


Adult Rule of Nines for burn % TBSA

Pediatric Rule of Nines for burn % TBSA with associated growth chart
TBSA along with age are the best indicators of mortality and morbidity when considering large-scale burns.

Additional diagnostic tools such as MRI, x-ray, and others are used to predict possible complications associated with burns. For example, electrical burns may present much differently than fire/flame injuries. Often with electrical burns the greatest level of damage is not to the epidermis and dermis but instead internal tissues and organs. Through the use of MRI physicians can get a better idea of internal tissue necrosis and involved tissues.

For further information about classifying burns and their associated treatment please see the below sources.

American Burn Association. National Burn Repository. 2012th ed. Chicago: n.p., 2012. Web. 4 Apr. 2015. <http://www.ameriburn.org/2012NBRAnnualReport.pdf>.

Burn Triage and Treatment. 2012. U.S. Department of Health and Human Services. Web. 4 Apr. 2015. <http://chemm.nlm.nih.gov/burns.htm#general>.

Blahd, William. Rule of Nines. WebMD, 27 Dec. 2012. Web. 4 Apr. 2015. <http://www.webmd.com/first-aid/rule-of-nines>.

Saad M. AlQahtani, MD, MSc(C); Mohammad M. Alzahrani, MD, MSc(C); Alberto Carli, MD, MSc; Edward J. Harvey, MD, MSc, FRCSC

Friday, April 17, 2015

Cause (Review) and Systemic Response

Causes of Burns

The pie chart below and associated graph illustrate the most common etiology or causes of burns.
Does this look familiar? That's because it was also in last week's blog post but that doesn't make it any less important. We can learn a number of important of facts from this graph. First, notice that fire/flame injuries are the most common cause of burns, followed closely by scald injuries. Second, consider the different causes of burns. Prior to my research, I had not considered chemical burns at all. Knowing the cause of a burn can greatly influence the type of treatment that a burn will require. Lastly, recognize the category of skin disease is not representative of a type of burn. These statistics above reflect the number of cases handled by burn centers. Burn units often treat skin disease such as stevens-johnson syndrome or TENS (toxic epidermal necrolysis syndrome), for example, because of burn units are accustomed and prepared to deal with extreme cases of skin damage and its associated complications.

Systemic Response

As a result of large-scale burns there are a number of systematic complications that often take place. Within the first hours of a burn capillary permeability will increase drastically causing a major loss of intravascular contents. These fluids accumulate in the interstitial spaces and will cause edema. This loss of vascular contents also cause patients to become very hypovolemic and suffer from very low blood pressure. These changes in vascular volume also can lead to a lack of perfusion to vital organs. For these reasons, it is obvious why burn patients undergo aggressive fluid replacement in the hours following their burn. 

In addition to complications related to vascular permeability and vascular volume, burn patients can also suffer from respiratory and metabolic complications. When the body is burned, inflammatory mediators are released which add to the inflammation response and edema but these mediators can also cause constriction of the bronchioles resulting in respiratory distress syndrome. 

The body's basal metabolic rate also increases drastically as a result of large burns. Because of this increase in metabolic rate, burn patients often undergo aggressive enteral feedings in order to preserve the digestive system from damage (Hettiaratchy et al. par 3). 

Cardiac function can also be a major problem for burn patients. Changes in cardiac function are largely due to the changes in vascular volume but it is also thought that cardiac contractility is decreased due to the release of tumour necrosis factor alpha (TNF-alpha). TNF-alpha is released as a result of large scale burns and can be detected in the blood. Although, it seems that TNF-alpha is not initially elevated in large scale burns but instead appears after initial admission to a hospital (one hour post burn in one study I looked at). Defects in the heart contractility appear around eight hours post burn (Maass et al abstract). For more information on TNF-alpha in relation to burns please follow the below link and associated journal article.

Renal failure in burn patients is a complicated process as it is often a result of many compounding factors. Acute renal failure can be due to decreased perfusion of the kidneys because of hypovolemia and decreased cardiac output. Respiratory failure can also result in renal failure because of a lack of oxygen reaching the kidneys. Additionally, burns cause release of large amounts of inflammatory mediators, denatured proteins, and stress related hormones that can damage or suppress the kidneys. Nephrotoxic (kidney damaging) substances are often used in the treatment of burns. For example, many antibiotics used to fight the substantial risk of infection are harmful to the kidneys. Lastly, infection can also cause kidney failure (Emara et al. par 5-12). 

Finally, infection is a major risk factor for burn patients. When the integrity of the skin is compromised the body is very vulnerable to infection. To make this worse, the body's immune response is suppressed as a result of the trauma that the skin has sustained and resulting inflammatory response. Also, the intestines become more permeable due to the inflammatory response which allows natural flora in the intestines to migrate into the surrounding tissues (Farina et al. par 1). 

According to Hettiaratchy et al., once a burn has reached 30% TBSA or more these burn complications become systemic.

Obviously, the systemic burn response is a complicated and intertwined process. Hopefully, this is a helpful outline of some of the more common complications with burns. In upcoming weeks, I plan on expanding on these concepts and perhaps addressing the treatments associated with each.

Works Cited

American Burn Association. National Burn Repository. 2014th ed. Chicago: n.p., 2014. Web. 8 Apr. 2015. <http://www.ameriburn.org/2014NBRAnnualReport.pdf>.

Emara, S.S., and A.A. Alzaylai. “Renal Failure in Burn Patients: A Review.” Annals of Burns and Fire Disasters 26.1 (2013): 12–15. Print.

Hettiaratchy, Shehan, and Peter Dziewulski. “Pathophysiology and Types of Burns.” BMJ : British Medical Journal 328.7453 (2004): 1427–1429. Print.

Jayme A. Farina Jr., Marina Junqueira Rosique, and Rodrigo G. Rosique, “Curbing Inflammation in Burn Patients,” International Journal of Inflammation, vol. 2013, Article ID 715645, 9 pages, 2013. doi:10.1155/2013/715645

Maass, David L., Dixie Peters Hybki, Jean White, and Jureta W. Horton. "The Time Course of Cardiac NF-κB Activation and TNF-α Secretion by Cardiac Myocytes After Burn Injury: Contribution to Burn-Related Cardiac Contractile Dysfunction." Shock 17.4 (2002): 293-99. Print.


Wednesday, April 8, 2015

Burn Epidemiology

Every so often the American Burn Association publishes their "National Burn Repository Report." The 2014 National Burn Repository (NBR) report "represents ten years of cumulative data from 96 United States Burn Centers, four Canadian Burn Centers, and two Swedish Burn Centers. The report contains over 190 thousand entries" (p. ix par 1). This report is the most extensive and all-encompassing collection of burn data in North America. Unfortunately, the pdf document is 141 pages long and thus is difficult for novice learners to access. Regardless of it's length, I will attempt to glean some valuable pieces of information from this document and share it here on my blog. For those of you who enjoy burns and huge pdf files I have include the citation at the bottom of this post.

Quick Take-Away Facts

Of the burns patients reported in the 2014 NBR, 69% were male. The mean age for all cases of burns was 32 years old with children under the age of 5 accounting for 19% of cases. Interestingly, children under the age of 5 were the only age group who's most frequent burn injury was not fire/flame injury. The most frequent burn injury for children under 5 is scald injuries. The elderly over age 60 represented 13% of all burn cases. As you might expect, the greatest predictors for mortality in relation to burns are age and % TBSA. 

Causes of Burns

Fire/flame injuries are the most common type of burn injury followed by scald injuries. Fire/flame and scald injures account for almost eight out of every ten burn injuries.

Circumstances

Gender

Race/Ethnicity

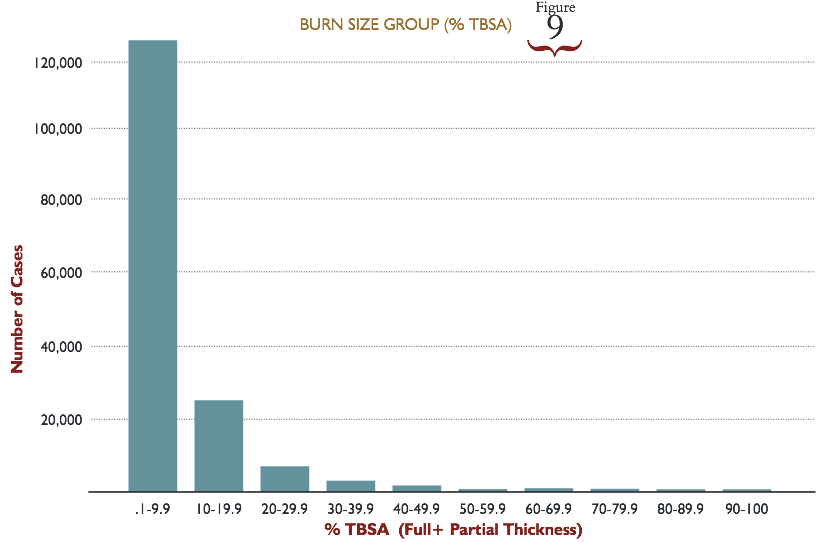
Burn Size (% TBSA)

Mortality Related to % TBSA

Recognize the direct relationship between % TBSA and mortality. Although it is interesting that roughly 50% of burn patients with TBSA of less than 69% survive.

Mortality by Age Group and Burn Size (% TBSA)


As I mentioned before, all of this information (an much more) can found in the pdf I have hyperlinked below. 

American Burn Association. National Burn Repository. 2014th ed. Chicago: n.p., 2014. Web. 8 Apr. 2015. <http://www.ameriburn.org/2014NBRAnnualReport.pdf>.

Saturday, April 4, 2015

Welcome and Defining Burns

Welcome

Thank you for visiting. First, let me explain who I am and why this blog exists. I am a University of Washington nursing student tasked with the job of creating a blog on burns as part of a class assignment. Additionally, I am a nursing technician on an Burn ICU/Pediatric ICU in a Seattle area hospital. Hopefully, this blog will be informational for all those interested in burns. Please feel free to comment and add your knowledge/experience in the comment section.

Second, please note that burns can be pretty brutal. I don't intend to censor or mask pictures of burns so proceed with the understanding that I will be posting pictures that some may find difficult to view.

(For professors and classmates)  
Lastly, burns do not simply fit into one of the four categories that we have been instructed to pick from (Pain, Cancer, Infectious Disease, GI/Fluids and electrolytes). Therefore, with the approval from my professors, I will attempt to address pain, associated infectious disease/infections, and GI/fluids and electrolyte imbalances associated with burns. For logistical reasons, however, you will find my blog in the pain blog group within canvas.

Defining burns

According to the World Health Orginization, a burn is "an injury to the skin or other organic tissue primarily caused by heat or due to radiation, radioactivity, electricity, friction or contact with chemicals." The causes of burns will be discussed in my third post titled "Burn Epidemiology."

Jackson's burn wound model is a helpful tool in understanding what happens when an individual is burned. The site of the primary injury is called the zone of coagulation. Typically, the zone of coagulation will have tissue necrosis (death) that is irreversible. Burns denature the proteins in this zone causing cell death. Surrounding the zone of coagulation is the zone of ischemia/stasis. In this zone, dermal circulation is reduced because of vascular constriction and platelet aggregation. Tissues in the ischemic/stasis zone may recover or die depending the wound care/resuscitation. If the tissue is not resuscitated and cared for it will surely die and the depth of the burn will increase. On the periphery of the burn, surrounding the zone of ischemia/stasis, is the zone of hyperaemia. The zone of hyperaemia will have an increase of blood flow and inflammation. This increase blood flow and inflammation is a result of the inflammatory cascade which is activated by tissue damage seen in burns. With the proper care, the zone of hyperaemia tissue should recover over time. 


Degree of Burns

As you may know, burns are also characterized by degree and depth. This will be covered in depth in the fourth blog posting titled "Diagnosis/Classification of Burns" but here is a graphic to get you excited.
Calvin College openURL resolver
Burn Pathophysiology. Victorian Burn Unit, Apr. 2012. Web. 22 Apr. 2015. <http://www.vicburns.org.au/burns-assessment/burns-pathophysiology.html>. 

Burns. World Health Organization, 2015. Web. 22 Apr. 2015. <http://www.who.int/violence_injury_prevention/other_injury/burns/en/>.